

Arctic warming and global warming.
The year up to July 31 has produced many examples of anomalous weather events globally. We have seen fires, floods, droughts and sandstorms on an immense scale. A new report shows that 10 out of 10 indicators of global warming are trending in the direction predicted when global warming was merely a theory, rather than a self-evident fact.
Global warming means that more heat is being trapped in our atmosphere and oceans. To cope with the excess of thermal energy the planet's atmospheric and ocean circulation systems must undergo dynamic reorganization. We see that reorganization as trends in formerly stable systems. Weather, seasons, climate: all are becoming less predictably cyclic than formerly. When climate cycles change, seasonal weather patterns become unpredictable. Predictable seasonal weather is essential to food production.
This year 2010 has produced many 'greatest this' and 'greatest that' extreme weather events1. Amongst these many extreme events, we are seeing an abundance of Arctic tundra and Taiga fires. Yet still much of the mainstream media gives global warming the cold shoulder2.
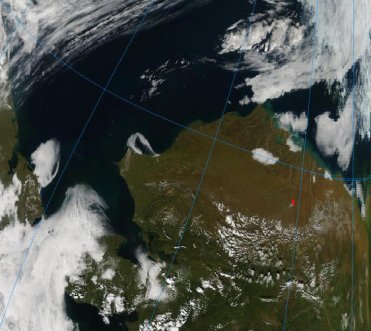
The current - August 01 2010 - MODIS mosaic shows extensive clouds of smoke from fires. I have composed the following image from images and layers available at the time of composition. The red fire markers are out of scale - if to scale they would mostly be invisible.
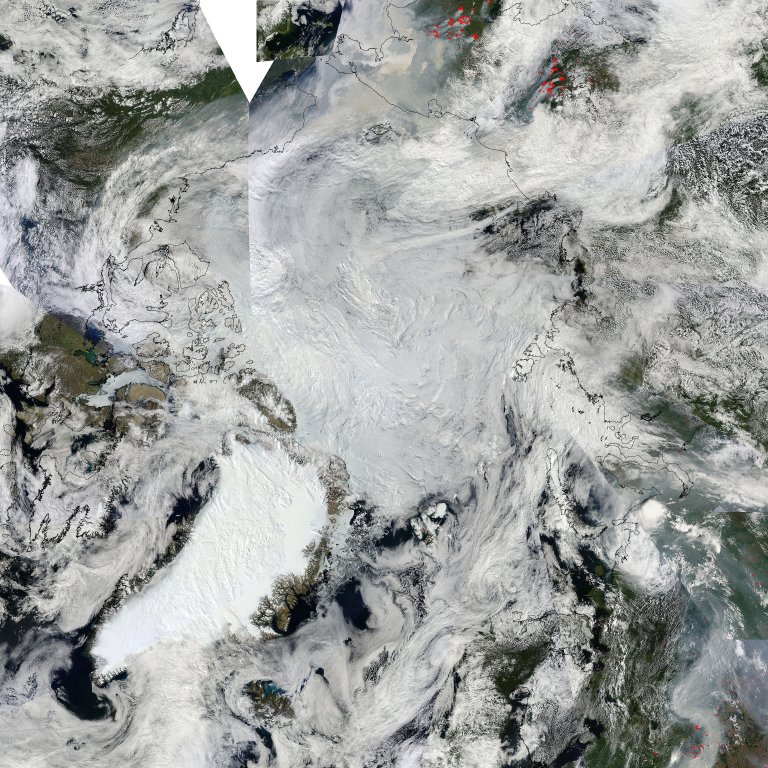
Arctic mosaic composed of aqua and terra images with overlays. August 01 2010
Next is an animation showing how the fires in Siberia have grown in number and scale since July 06 2010. Note the increase in pollutant content of the smoke over a short course of time.
Siberia fires animation July 2010
The next image shows smoke and and pollution extent over the Arctic Ocean. The fires are caused by the ignition of dry tundra and taiga. The lightning and the excessive drying are both due to heatwaves. The smoke drifting across the Arctic demonstrates that warm air is being conducted into the Arctic. Although the smoke will reduce melting of ice from direct insolation it will most likely increase the melting from warm air. On balance, I suggest, there will be more ice loss than if the smoke was not present.
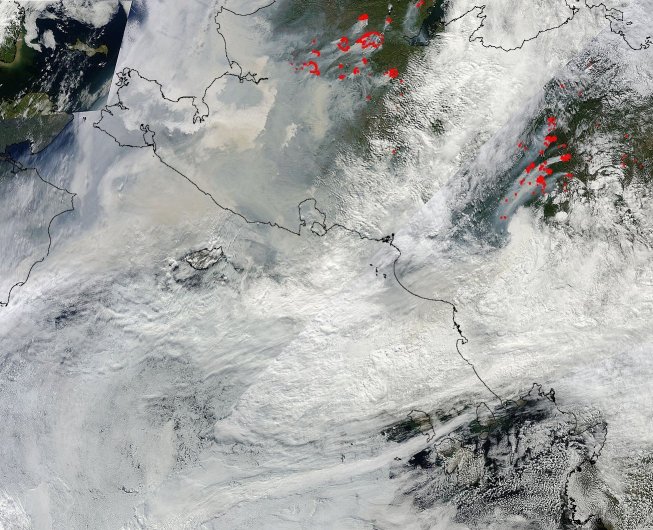
Smoke over Chukchi Sea
A large tundra fire in Anaktuvuk, Alaska in 2007 was Alaska's biggest ever. It looks a lot smaller from the perspective of the current fires in Russia.
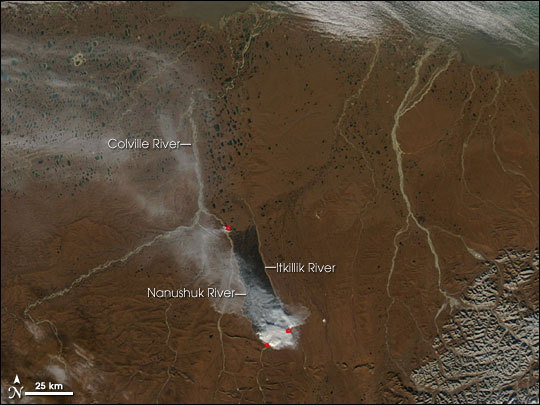
Tundra fire, Alaska September 25 2007. MODIS aqua image. The fire started July 16.
image source:
http://earthobservatory.nasa.gov/NaturalHazards/view.php?id=19139&oldid=...
Alaska tundra fire August 24 2007
image source:
http://rapidfire.sci.gsfc.nasa.gov/realtime/single.php?2007236/crefl2_14...
The state of the sea ice
There has been a lot of very interesting discussion about extent, area and volume over at Neven's blog. He has written a post on area-vs-extent. Notably, independent calculations of area/extent all show the current value to be quite low. Here's my own 'take' on how to understand what extent, area and volume mean in terms of ice melt trends.
If a fracture develops in ice and then rejoins, extent increases slightly but then reverts to its original value. If the gap contains large fragments then it won't be able to close, so extent will remain higher than the start value. If ice breaks up substantially and then the floes erode so that they can't fit together like a jigsaw puzzle then extent will remain high.
The only way that rounded floes with a lot of interstitial water can show a reduction in extent is by export, by melting in situ, or by compaction due to high winds driving the floes against a resisting object. If the water freezes over then that increases the area of ice as against the area of water within the zone of extent. A decrease of area over a given extent can be a sign of ongoing fragmentation, with increasing amount of interstitial open water. And in summer that water is warming.
If you take a sheet of steel and cut slots in it you can expand it to many times the original size: but it will still weigh the same, but for entirely trivial manufacturing losses. The size of the mesh is its extent. The area of steel in the mesh is the area of the mesh minus the sum of the areas of all the holes. The volume of steel is its area times thickness. You can make a lot of mesh out of a little steel if you wish, but the thinner the mesh, the faster it rusts.
When ice spreads out from fragmentation the 'manufacturing losses' are substantial. When ice cracks it releases heat, and some of that heat will melt at least some ice. The cracking of ice produces fragments, as do collisions between floes with hard edges. The fragments melt into a mush known as brash. The open water between the floes absorbs heat from the sun and the atmosphere and promotes melting. Fragmented ice has more surface area in contact with water than does consolidated ice.
Normally, when floes press against each other in a pack they raft: they over-ride each other in a uniform manner which aids consolidation and reduces melting. When a single floe nudges over the edge of another floe they both tip so that they have some of their area underwater. The technical term for this is negative freeboard. Negative freeboard ice melts faster in warm water than does flat-floating ice.
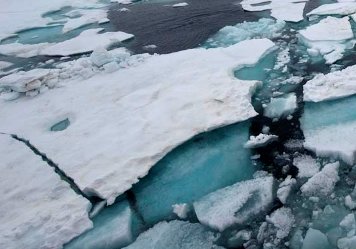
Negative freeboard ice and brash.
Sea water freezes at minus 1.9oC. It follows that if Arctic temperatures are observed to be generally above that point then open water will not freeze over. Unless a violent wind causes compaction by rafting and ridging there is no way that ice area can be made equal to ice extent.
In Arctic Ice June 2010 and in a comment to Arctic Ice July 2010 I made predictions of ice extent.
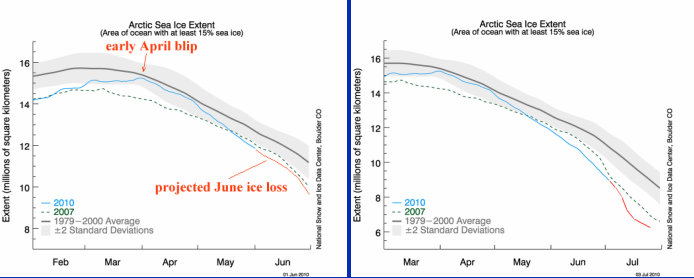
My June and July projections
As you can see, the first prediction underestimated the ice loss. It turns out that the July prediction overestimated the loss. I have been 'peering through the clouds' courtesy of the MODIS 250m resolution images. What I am seeing is highly fragmented ice with very few areas that are free of interstitial open water.
Arctic ice projection for August.
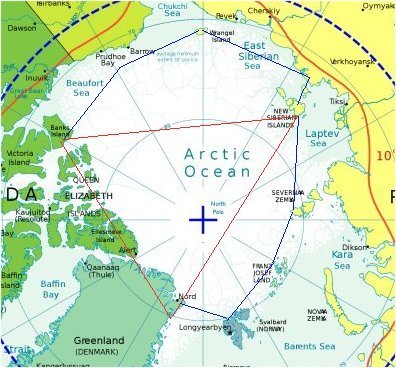
Judging by glimpses through clouds, by images from USCG Healy and from the North Pole camera: most of the remaining Arctic ice is a meter thick or less; it is substantially covered in meltpools many of which connect with the sea through holes in the ice; if pushed completely together with no overlaps so as to eliminate all open ocean interstices it would be reduced in extent to about 60% or less of its current extent. That's about the area of the triangle in the map above.
Ice continues to be exported slowly through the Fram Strait. The flow into the Nares Strait appears to have resumed. If normal circulation patterns return, these flows will increase. Additionally, ice-free passages in the Canadian Archipelago would allow some ice to drift into warmer waters and melt. The Kara Sea is warming, so any ice which drifts between Novaya Zemlya and the mainland will melt.
At the north east tip of Greenland, near Nord on the above map, is Flade Isblink. This ice cap often receives fresh snow cover, but it melts away rapidly. I have compared images from past years and it seems that the ice cap is thinning. The thin snow cover in the 2002 image below can be ignored. Of greatest interest is the slope to the right of the gauntlet-shaped area indicated by the red arrow in the 2002 image.
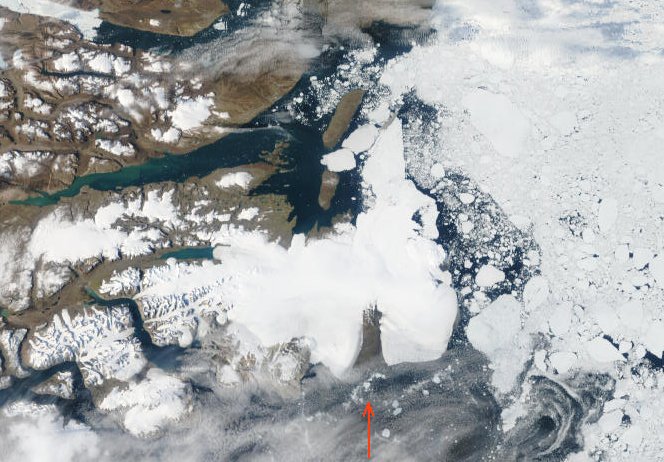
Flade Isblink August 31 2002
.
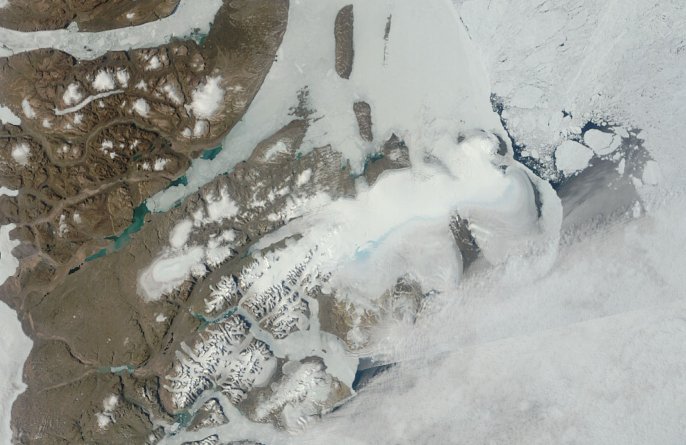
Flade Isblink July 2009
.
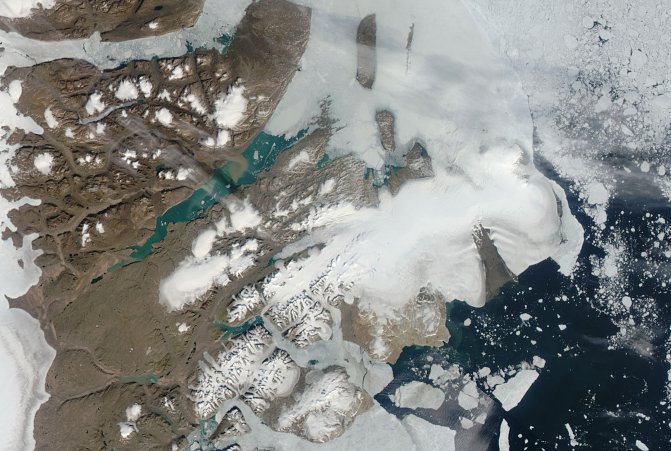
Flade Isblink July 2010
.
To the left and right of the gauntlet-shaped feature you can see what I would call terracing. This is becoming more pronounced. Patterns of melting and fragmentaion of sea ice are highly variable in this region, but the thickness of the ice cap is not. It has certainly thinned since 2002 and appears to have thinned a little since July 2009.
The sea in this area is always warm, but shorefast ice is an impediment to ice export until it breaks up. In 2007, the year of - thus far - greatest ice loss, the ice in this area had an average pattern. Despite a projecting nib of ice in the Fram Strait - a common feature of Flade Isblink - there was a substantial loss of ice through the Fram Strait in 2007.
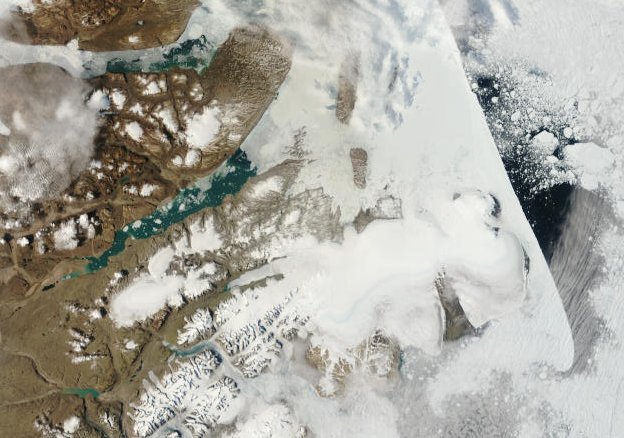
Flade Isblink August 01 2007
My projection for ice extent is that the extent figures will trend downwards as ice melts at the fringes of a thin, loose pack in an Arctic that is averagely warmer than it was in 2007. By about the third week of August I expect the 2010 extent line to be crossing the 2007 line, as shown below.
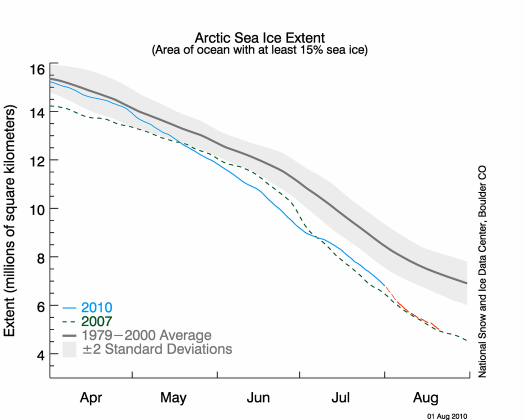
Image modified by me from an original NSIDC graphic.
http://nsidc.org/arcticseaicenews/
Footnotes:
[1] - some extreme weather events of 2010 -
Wildfires
Washington and British Columbia:
http://seattletimes.nwsource.com/html/localnews/2012509028_fire02m.html
Los
Angeles:
http://www.google.com/hostednews/ap/article/ALeqM5g4rSxtb6hFEjzSiMFwAKeO...
Russia - Hundreds of new fires broke out Sunday in Russian forests and fields that have been dried to a crisp by drought and record heat:
http://www.google.com/hostednews/ap/article/ALeqM5iX-16FttPkCulMdckFjFJy...
Floods
Pakistan - over 1100 killed:
http://www.dailymail.co.uk/news/worldnews/article-1299393/Pakistan-flood...
China - heavy rains overflow reservoir and damage pipes:
http://www.reuters.com/article/idUSTOE67105A._CH_.2400
Heatwaves
Japan - 66 people died since early July
from heat:
http://www.dailymail.co.uk/news/worldnews/article-1298772/Japan-China-ex...
China - heatwave with temperatures exceeding 35 degrees Celsius in 18 provinces, municipalities or autonomous regions, according to the National Meteorological Center.
http://news.xinhuanet.com/english2010/china/2010-07/29/c_13421341.htm
http://news.xinhuanet.com/english2010/china/2010-07/31/c_13423747.htm
Drought
Pakistan:
http://www.independent.co.uk/news/world/asia/record-rains-ndash-but-paki...
[2] - to give the cold shoulder: to snub, ignore or disrespect a person or thing.
----------------------------------------------------------------------------
More articles on the Arctic and related topics:
The
ChatterBox Arctic Index
Recommended related blogs and articles:
Neven on Arctic Sea Ice - interesting news and data:
http://neven1.typepad.com/blog/
Mauri Pelto on glaciers:
http://glacierchange.wordpress.com/2010/07/26/lemon-creek-glacier-retrea...
Dirk Notz on Arctic Sea Ice - hat tip to Artful Dodger
for the 'heads-up'.
http://www.realclimate.org/index.php/archives/2010/07/an-icy-retreat/


Comments