Banner
    Arctic Ice July 2011
    By Patrick Lockerby | July 13th 2011 01:15 PM | 18 comments | Print | E-mail | Track Comments
    About Patrick

    Retired engineer, 60+ years young. Computer builder and programmer. Linguist specialising in language acquisition and computational linguistics....

    View Patrick's Profile
    Arctic Ice July 2011

    For much of the written history of the Arctic, exceptional extents of open water were reported in terms of what the explorer, fisherman, whaler or sealer had previously experienced.  That would make such events likely every 20 to 30 years.  However, for each report of open ice in a specific area there is likely to be found in the archives a report from 180 degrees opposite across the pole of a greater than usual ice extent.

    Within recent decades, and especially in the 21st century, we constantly see reports that total ice extent is the lowest, 2nd lowest or 3rd lowest ever recorded.  So far the lowest ever ice extent was in 2007 and we have charts and reports which show no such low extent since at least the 16th century.  It needs no great mathematical skill to deduce that if every year shows an ice extent amongst the lowest ever, there must have been some great change in the Arctic dynamic.

    Data from NSIDC shows, by way of example, that 2005 extent had at the time the lowest ever extent.  2006 became the 4th lowest.  2007 marked a new lowest ever and 2008 marked a new 2nd lowest.  2009 was 3rd lowest but was pushed aside as 2010 produced a new 3rd lowest extent.

    Unless there is a most dramatic change in the current Arctic dynamic, 2011 is virtually certain - in my opinion - to mark a new low with one of the 3 lowest ever extents.


    2011 - the story so far

    Despite a slow start to the melt season due to unusually low temperatures over the Canadian Archipelago, the ice extent at this moment stands below that of 2007 for this day and has generally tracked below 2007 extent since May.  The following AMSR-E sea ice extent graphs show this quite clearly.


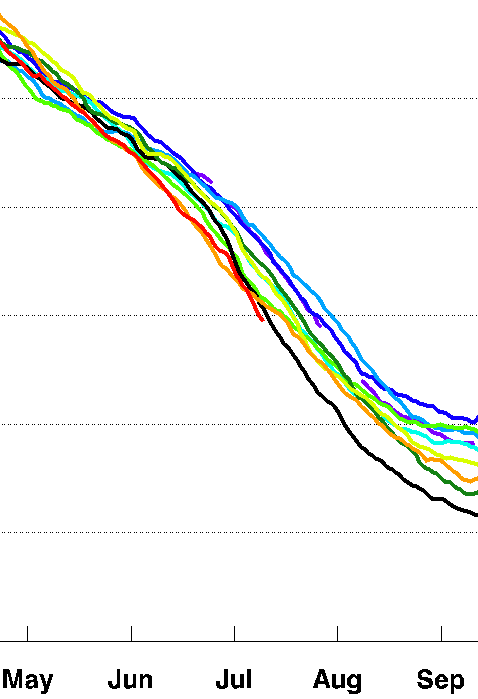
    Sea ice extent July 11 2011
    images source: http://www.ijis.iarc.uaf.edu/seaice/extent/

    The Cryosphere Today sea ice anomaly timeseries shows that the anomaly plot for 2011 closely resembles that of 2007.  The following graphic is modified from the original to highlight the similarity.


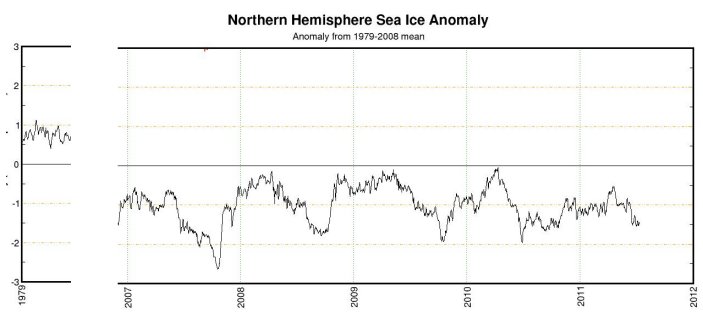
    2007 and 2011 anomalies compared
    original graphic link: Cryosphere Today tale of the tape

    The above graphics represent a new Arctic regime and a new reality.  Before, reduced ice extent in some part of the Arctic would often be matched by increased extent elsewhere.  Now, however, virtually any observer in the Arctic could say from May 2011 until now that they have never before seen so much open water in the Arctic at this time of year.


    The view from rotten ice

    When scientists select a floe on which to pitch their instruments, they obviously select the biggest, thickest floe that they can find.  This year, the floes on which the North Pole web cams were placed have proven to be somewhat weak.  Camera #1 appears to have toppled somewhat due to a crack in the ice - visible bottom right of image.  Camera #2 shows a vast melt pool which has drained through the ice.  Whether a floe is covered with snow or water makes no difference to its mass.  But if the water drains away, the reduced mass causes the ice to float higher.  The combined effect is to make it appear that the meltwater level has dropped more than it really has.  The raised freeboard of the ice is shown by camera #2 - a large chunk of ice has been left stranded above the new water level.


    Polecam #1


    Polecam #2
    images source: http://www.arctic.noaa.gov/gallery_np.html

    If these floes are thicker than average for the region then the ice near the pole must be of exceedingly low average thickness.  The graphic below shows that a majority of the sea ice is below 3 meters thick.  Over half of the thickest ice is situated where it can be flushed out of the main pack through Fram Strait or Nares Strait.


    image source: nrlssc.navy.mil/pips2

    Ice is now flowing freely through Fram Strait.  Once the ice plug had melted and broken up, the ice behind it was certain to break up rapidly, being made up of floes glued together by this years new ice rather than by any great amount of pressure.

    One effect of the free flow appears to me to be the relief of some of the pressure in the main pack.  This would tend to enhance the ability of floes to jostle their way out of the Arctic through Fram Strait.  I may be wrong, but it appears to me that at least some of the ice loss in 2007 was due to enhanced flow through Fram Strait due to a pack which was more open than usual.  That enhanced flow through Fram Strait happened when Nares Strait was open.

    The only region where the main pack still presents an obstacle to passage along the Eastern route is at the coast between the New Siberian Islands and Logashkino, at the mouth of the Alazeya river.  In the main North West Passage, the ice which still blocks the route is confined to about a third of the length of the passage and is currently in process of breaking up.

    I made the following prediction in my article Global Cooling : Beyond Parochialism,
    January 16 2010
    2011:
    Reduced ice cover affects sea temperatures, in turn affecting Arctic current flows and air movements. Thinner ice, instead of piling up as pressure ridges due to compression effects, cracks into sections due to tension and agitation effects.
    The Arctic is virtually ice-free by late summer: there is open water at the North Pole.
    The ice is certainly much less compacted than in former times and the Beaufort Gyre - one of the drivers of compaction - appears to have been neither powerful nor steady so far this year.  There is still a chance of seeing extensive open water at the North Pole if the loss of extent continues to track close to or below 2007 levels.

    Time will tell.
    -----------------------------------------------------------------------------

    Footnote:

    As always, I welcome all contributions.  I apologize in advance if I am unable to find time to respond to every comment, although I will try.  My regular readers will know that I have been a bit ill lately, but quite apart from that I have been researching the history of climate science in considerable depth.  At this moment I am working on the translation of a rather old French climate science paper of considerable importance to science history.

    I have recently written some articles on topics related to my recent historical researches.  Being related to Arctic science I have put them in The ChatterBox Arctic Index.


    For regular Arctic ice updates, interesting chat and some very good scientific discussions, please visit Neven's Arctic Ice Blog.

    Also highly recommended: Skeptical Science.

    Comments

    I am completely unconvinced that the Nares Strait has any discernable effect on anything outside the Lincoln Sea.

    Nick, from what I've read from you, you know quite a bit about ice. But, here is something that baffles me:
    According to SEARCH ice outlook, the Canadian ice service has the opposite opinion. Here is the statement in their prediction:
    A reduced spring 2011 MYI pack has left the bulk of the Arctic Ocean covered in FYI,
    indicating that well below normal end-of-melt season ice extents can be expected in
    September 2011 (≤5 million square kilometres). However, note that the ice in Nares
    Strait consolidated and became land-fast in mid-February as per normal in 2011,
    something it has not done since 2006. The ice in Nares Strait, as of the first week of
    July, is heavily fractured and the strait is expected to clear in mid-July as per the 1968-
    2000 normal. The formation and clearing of fast ice from Nares Strait is an important factor in the annual blockage, and hence the annual duration of free passage and volume
    loss of MYI from the Arctic Ocean to Baffin Bay. Since Arctic MYI did not
    experience free passage through Nares Strait throughout the winter of 2011 as it did
    in 2007 and 2010, a normal concentration of MYI currently exists in the Lincoln Sea
    area and north of Ellesmere Island at the beginning of July, 2011. This factor may be
    just enough to prevent record-breaking minimum ice concentrations and extents in the
    Arctic Ocean in 2011.

    Here is the link:
    http://www.arcus.org/files/search/sea-ice-outlook/2011/07/pdf/pan-arctic...

    Simply enough: the Nares Strait is about 30 km wide, ice drifts down it at about 30km per day, so no more than 1000 square km of ice can be exported down it on a good day. There are many bad days, when the strait is slow or actually blocked, even when there isn't a bridge. Over a good melt season, perhaps 100k square km of ice might be exported down the Strait.

    Compare with Fram Strait, which has over ten times the width and which often exports ice year-round.

    For similar, but even stronger, reasons, essentially no ice is exported from the Arctic Ocean through the passages between the islands in the archipelago.

    I think that it is *possible*, but only possible, that in the future, when the strait and the passages are clearer for more of the time, and when the sea ice in the ocean is more mobile year-round, that these exits will have greater effects.

    (what the Canadian's seem to be saying, and they are the experts after all, is that the ice exported through Nares is mostly MYI, so its export is significant. Fair enough).

    Patrick - I hope this finds you feeling better.

    Your prediction of an open circumpolar sea route in 2010 has proven accurate:

    "By September the Arctic Ocean is freely navigable by both the northern sea route and the north west passage."
    http://www.ousland.no/blog/ and,
    http://english.ruvr.ru/2010/10/01/23477829.html give the accounts of both expeditions.

    My hope - nothing personal, you understand - is that your prediction for 2011 will be limited to polynyas or surface ponds.

    Meanwhile I watch the progression of the Arctic Ocean's story with considerable interest. Your commentaries and historical annotations are greatly appreciated and anticipated.

    Spaz

    Will Crump, if the Arctic ice extent were to drop to 2 million km^2 that would completely shatter previous minimums and represent the greatest single year drop on record. Scientists would be freaking out about the catastrophic implications. Basically, this figure you dismissively cite would indeed be considered 'nearly ice free' when considered against the 14 million km^2 size of the Arctic ocean. Indeed, while I think it is possible that Patrick's prediction will come true (conditions are trending that way, but a weather shift could still overturn it) I doubt we'll see anything close to 2 million km^2. That'd be very very bad.

    Also, you need to remember that ice MOVES. If all the 'fringe regions' melt out then there is no logjam blocking the ice in the basin from flowing out into these warmer areas and melting. Finally, you also need to consider the thickness and volume of the ice... both at record lows. The thinner the ice the easier it is to melt through and the less total volume of ice the less total energy required to melt it all. If ice volume continues to decline at the rate it did from 2006-2010 (and so far this year it has) then we are looking at zero volume before 2015... and zero volume perforce means zero thickness, zero area, and zero extent.

    CB:

    Your point is well taken if I were referring to the Arctic as a whole, but I was not doing that and you have misread my post.

    I am not suggesting that Arctic ice extent as a whole will drop to 2 million km2. I am specifically referencing ice area as measured by Cryosphere Today and I am only referring the the region they call the Arctic Basin. Please see the link I provided in the original post.

    In fact, a drop to 2.0 million km2 of ice area for this region would not shatter the record minimum for this region as it would barely eek out the previous record minimum from 2007 of 2.1 million km2 based on graph F in the article in the link below:

    http://www.arcus.org/search/seaiceoutlook/2010/pre-release

    The minimum for this region in 2006 was in excess of 2.6 million km2, thus even if this region dropped to 2.0 million km2 in 2011 (an event I also consider highly unlikely), it would not represent the single greatest drop on record.

    The record low minimum of 2.1 million km2 in 2007 was followed by a rebound (lets not call this a recovery, because it is not) in 2008 to 2.4 million km2 and the minimum for both 2009 and 2010 held steady at 2.5 million km2. These levels are still well below the mean minimum level, but this region is not showing the kind of rapid decline that the Arctic wide charts show.

    My soapbox issue is with regards to what I consider to be reckless statements that the Arctic will be "virtually ice free" in 2011 or any time soon. I believe the well meaning purveyors of this type of statement are using a bad data set since they are following trend lines for the Arctic as a whole. I am expecting that these trend lines will flatten out since many regions that have contributed to the declining trend line have already lost all of their ice at the minimum and can not contribute to the decline rate (a region can not have negative ice extent or negative volume).

    I also believe the PIOMAS volume trend line is unreliable as a predictor since it may only being showing the trend line for the decline in volume of multi-year ice, which is already nearly absent from the Arctic. I believe that the reason area and extent have been able to stay relatively stable over the last few years while volume has declined precipitously is that the volume decline is related primarily to multi-year ice. I would like to see a data set that shows the volume trend for first year ice alone or thickness trends for first year ice, as I suspect it is nowhere near as steep as the PIOMAS Arctic wide volume trend line. I believe the volume trend line will flatten out since there is very little thick multi-year ice remaining to cause a future decline in the trend line.

    Intuitively your statements about melting thin ice make sense, but observations show that first year ice can be quite persistent. (perhaps because it does not sit as deep it is able to maintain a thin layer of cold water that insulates it from warmer deeper waters. The graphs I have seen indicate that temperature increases as the depth increases.) It is the area covered by multi-year ice that has suffered the greatest decline. First-year ice has ventured into areas vacated by multi-year ice, perhaps expanding the area covered by first year ice.

    Even with all the possible heat sources affecting the Arctic, it appears that a significant portion of ice that forms in the winter survives the September minimum.

    When I look at Graph F in the link above for the Central Arctic Basin, a significant region comprising approximately 4.2 million km2 at its maximum, I see a slower rate of decline in the trend line. Perhaps the rate of decline for this region will accelerate with the loss of ice from surrounding regions, (your point about ice movement is well taken) but so far that has not shown up, as the region has been above 2.4 million km2 of ice area at the minimum for three years and shows every indication that it will be above 2.4 million km2 in 2011.

    So far in 2011, the Arctic Basin region has maintained levels comparable to the mean for 1979 to 2008 (based on the red anomaly line in the Cryosphere Today chart). My unscientific prediction for this region for 2011 is that it will be above 2.4 million km2, barring some unusual weather pattern, as it is currently following the mean and appears to be above 3.5 million km2 when last year at this time it was closer to 3.25 million km2.

    Thank you for taking the time to respond to my post.

    Neven
    Will, not that I disagree with what you say, but there's another graph that shows sea ice extent in the Central Arctic compared to previous years. It's from the NISDC/NIC MASIE product:


    The region is not measured the same way as CT does, but it's still interesting to see.
    Thanks Neven.

    I appreciate the work you are doing in maintaining a blog.

    That looks like a big drop on the graph, but it could be exaggerated due to the scale that MASIE uses. If I am reading the scale correctly, 2011 is 20,000 km2 below 2010 and about 85,000 km2 below 2008. That does not seem like much of a difference for a region with over 3 million km2 of ice

    Looks like 2011 has dropped about 70,000 km2 over a 15 day period. That looks like a slow melt rate as there is 3,150,000 km2 remaining and there are only 62 days until we get to September 15th.

    The Cryosphere Today graph has a zero baseline, marks out a scale in 250,000 km2 increments, and provides 12 months of data plus an anomaly line. MASIE provides one month of data and marks out the scale in 10,000 km2 increments. The zero line for the MASIE chart would be several feet below the baseline of the graph.

    Using the NSIDC database, what were the minimum amounts for September for the Arctic Basin for 2007 through 2010and what is the rate of decline for the Arctic Basin?figures for average melt rate?

    Will, given that the claim by Patrick which you were 'disputing' referred to the Arctic as a whole it is somewhat self-defeating to argue that you were speaking only of the Arctic basin. No, a 2 million km^2 extent would not be a nearly ice free Arctic basin... but that's not what Patrick said. In short, you'd then be contradicting a prediction he never made.

    In any case, even if the Arctic basin does not start to show more significant ice loss (which I believe it will) the current extent there would still represent a new record low if all the surrounding areas melted out. Granted, that has never happened before, but as you note the ice extent is currently extremely low in nearly all of them. The Greenland Sea being the major exception... but then high Summer extent in that area is often due to increased export from the Arctic basin.

    BTW, the counter argument to the 'volume loss has been mostly due to loss of older ice' view is... 'ok, the older ice is virtually all gone... so why is the volume decline accelerating?'

    Neven
    Patrick, great to see you have made some time and energy available for another Arctic sea ice analysis. I wish you the best of health, so you feel good enough to write more the coming weeks. Yes, I'm being selfish here. :-)

    Minor quibble:

    Ice is now flowing freely through Fram Strait.  Once the ice plug had melted and broken up, the ice behind it was certain to break up rapidly, being made up of floes glued together by this years new ice rather than by any great amount of pressure.

    You mean Nares, right?
    PIOMAS shows a volume anomaly of -10,000 cubic kms at the end of June.
    The anomaly has been dropping at a rate in excess of 1,000 cubic kms per month.
    If this continues the anomaly will be less than -12,000 at the end of August.
    Since the average low for September is 12,000 cubic kms, an anomaly of -12,000 means no ice.
    QED

    vergent:

    The anomaly does not work that way and I would be willing to put up big money to bet that there will still be ice at the September minimum.

    Instead of the anomaly chart, please look at the "total ice volume" graph and the shape of the curves in prior years. That graph shows there will be ice left at the September minimum in 2011.

    As CBDunkerson so aptly put it, "to drop to 2 million km^2 that would completely shatter previous minimums and represent the greatest single year drop on record. Scientists would be freaking out about the catastrophic implications."

    CBD:

    I thought you did a pretty good job of debunking the idea that the Arctic would be virtually ice free in your comments, and I agree it is not clear exactly what Patrick means when he says "virtually ice free". That description is apt if you are talking about regions other than the Arctic Basin, the Canadian Archipelago, East Siberian Sea or the Greenland Sea.

    I selected the Arctic Basin as a counterpoint because it makes up more than 75% of the ice that remains at the September minimum. The Arctic will not be "ice free" unless this region is cleared. From my little understanding, many of the "ice free" commentators hedge their bet by excluding certain coastal areas of Greenland and the Canadian Archipelago.Also, if I "see" a big white patch, that is not a cloud, in the Modis Arctic composite in the Arctic Basin, then the Arctic is not ice free.

    Patrick:

    Get well soon and thanks for the very interesting article.

    Always enjoy your posts on sea ice. The next 4 weeks will be some of the most interesting weeks of the year for the Arctic. We should see both the NW and NE passages open up once again. We have lots of warm water in the southerly areas of the Arctic, and divergences of ice from the Arctic basin toward these southerly areas will melt pretty fast, though the divergence itself will show up as a slowing of extent loss. Here is where it would be so nice to have a truly accurate measurement of the thickness of the ice, as so much of this late season melt is from the bottom. At some point, the ice in the Arctic basin will reach a critical point of thickness where it will go crashing through that 2.5 million sq. km. extent barrier. Could this August be it? Not impossible, but not obvious either. From the web cams, we see lots more in the way of melting in the basin this year, and the high pressure these past few weeks has helped. Now we are going to see some more variable pressure and weather for a while, but if the dipole anomaly sets up as it looks like it could, this could bring warm a strong meridonal flow of winds moving across the Arctic from the Pacific side to the Atlantic, increasing the export of ice out of the Fram Strait, and keeping this year on pace to challenge 2007 for minimum extent.

    One thing everyone should keep in mind...even if the extent this year does not eclipse 2007, there is still going to be less total ice volume in the Arctic this September/October than 2007 as overall the ice is much thinner now than then. This is a significant point, as this continued thinning ice is what really sets up the conditions for that summer in the not too distant future when we do see the entire Arctic virtually ice free.

    What I see will happen in the Arctic Sea: I live next to a lake here in Scandinavia, some springs we see the ice just disappear overnight after a period of high pressure and no wind, and with windy years it can take days to disappear. I believe the Arctic Ice will eventually behave the same way, it will be gone in a few days, not in 2011 but very soon thereafter . And it will make headlines all over the place, but too late!

    Espen, I have seen the same thing happen myself on lakes here in Washington State, USA when ice covered lakes melt. I agree about the Arctic. Ice will keep getting thinner and thinner, yet maintain a notable extent, and suddenly it will be gone, not this year more than likely, possibly but not likely next year; after that though in the next 2 to 5 years it will suddenly be gone. Ice volume, temperature, weather conditions, rate of ice decline, etc., show this to be likely barring a nuclear war or a large volcanic eruption.
    On another note, look at Webcam #1 and the increasing tilt: http://www.arctic.noaa.gov/latest/noaa1.jpg
    From the last photo it looks to be tilting 25 to 30 degrees of horizontal. Unless it is lashed down very firmly it looks to me like it could topple before too long.

    A new blog referenced by Neven by Chris R has a reference to a study that shows very little thinning for first year ice compared to multi-year ice.

    The blog is at:

    http://dosbat.blogspot.com/2011/07/in-previous-post-i-looked-at-what-had...

    The following is excerpted from that blog:

    {There is a] paper by Cecilia Bitz & Gerald Roe "A Mechanism for the High Rate of Sea Ice Thinning in the Arctic Ocean", Journal of Climate 2004. In it Bitz & Roe note observations of the thinning of Arctic sea-ice from Submarine cruises under the ice. What they find is interesting and at first glance appears puzzling: There is a relationship between the initial thickness of the sea-ice and how much it thins. Between 1958-76 and 1993-97 4 metre thick ice thinned by around 2 metres yet 3 metre thick ice only thinned by around 1 metre, with ice around 1 to 2 metres hardly thinning at all! As Bitz & Roe note, their work is an expansion of earlier work by Thorndike (1992), and by Hansen (1985) - Hansen yet again is ahead of the pack.

    Later the article states:

    First year sea-ice can rapidly grow to around 2 metres thick in one season, once the initial layer of ice has formed (called Nilas) it coheres to form a layer of ice. Further growth is by freezing onto the base of the sea-ice, for the ice to grow this way there has to be a flux of heat throught the ice, the ocean is liquid so is therefore above freezing.

    After some equations the article continues:

    So you can see that as the ice thickens (z increases), the heat flux through the sea-ice rapidly decreases. You may also appreciate that as sea-ice thins it can release more heat into the atmosphere from the ocean. This is a negative feedback, as we see a thinner ice-pack it should release more heat into the atmosphere, which acts against the processes putting heat into melting the ice (e.g. ice albedo feedback).

    As mentioned in the previous post, First Year (FY) sea-ice can typically grow to around 2 metres thick in one season. However the thicker, older MY ice mostly grows not thermodynamically, but by mechanical processes: Compression and ridging. So we have 2 types of ice; quick growing FY, and slow growing MY, and it is the very difference in rates (time constants in Bitz & Roe) that accounts for the differences in thinning for different thickness. Amidst an array of processes that are melting or moving the ice, the thin (FY) ice is more rapidly able to grow back each Winter, while it takes years for the thicker ice to grow back. This is why the MY ice has thinned more than the FY.

    Later in the article:

    Kwok & Rothrock note that between 1980 and 2008 winter peak thickness declined from 3.64m to 1.89m, a decrease of 1.75m with 0.44m of the decline between 2000 and 2008. The summer decline between 1980 and 2007 is from 2.80m down to 1.15m.

    In the face of the processes leading to a reduction in ice volume the thick ice hasn't got a chance, it can't grow back unless the current envionmental regime in the Arctic changes to allow it's slow accumulation over periods of years. And it's the thick ice that the ice pack needs to be resistant to weather driven losses such as 2007.

    For those wanting to read more but reluctant to read scientific papers, here's an article from Physics Today.
    Kwok & Untersteiner, 2011 article, "The thinning of Arctic sea ice." Physics Today. PDF.

    Bitz & Roe, 2004, "A Mechanism for the High Rate of Sea Ice Thinning in the Arctic Ocean." Journal of Climate. PDF.
    Kwok & Rothrock, 2009, "Decline in Arctic sea ice thickness from submarine and ICESat records: 1958–2008." GRL. PDF.

    Patrick:

    The above analysis indicates that first year ice is declining at a slower rate than multi-year ice. Does this analysis support the view that first year ice will last longer than the trend line extrapolations done using the Arctic as a whole (both extent and volume graphs) since these extrapolations are treating first year ice in the same manner as multi-year ice?

    logicman
    A hearty 'thank you' to everyone who has put forward their comments and criticisms.

    I have tried to take these on board in my Arctic Ice July 2011 - Update, but if I have overlooked any point, please do speak out.  I'll try harder to make time to address individual comments over there.