

It has long been predicted that as the amount of CO2 in the atmosphere climbs, so too will the average global temperature, with the greatest temperature increases being seen at the poles. This year, the polar amplification effect is in full swing, with exceptional global losses of sea ice.
Sea ice hits record lows
Average Arctic sea ice extent for November set a record low, reflecting unusually high air temperatures, winds from the south, and a warm ocean. Since October, Arctic ice extent has been more than two standard deviations lower than the long-term average. Antarctic sea ice extent quickly declined in November, also setting a record low for the month and tracking more than two standard deviations below average during the entire month. For the globe as a whole, sea ice cover was exceptionally low.
Source: NSIDC Arctic Sea Ice News and Analysis December 2016
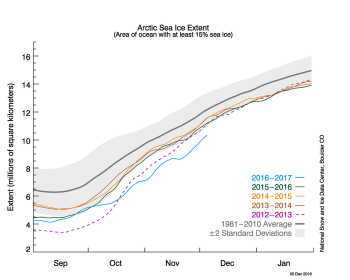
Figure 2a. The graph above shows daily Arctic sea ice extent as of December 5, 2016, along with daily ice extent data for four previous years. 2016 is shown in blue, 2015 in green, 2014 in orange, 2013 in brown, and 2012 in purple. The 1981 to 2010 average is in dark gray. The gray area around the average line shows the two standard deviation range of the data. Sea Ice Index data. Source: NSIDC.
Something is wrong in the Arctic. Winter just can’t establish itself over the Arctic ocean. In late November cold air finally started to build up over the American side of the Arctic ocean but now crazy jet stream winds are blowing all the way from subtropical waters east of Japan across Siberia, cross the Arctic ocean and into western north America. The Arctic just can’t hold in its cold air in this fall.
By FishOutofWater 2016/12/02
Continuing the warm Arctic pattern seen in October, November air temperatures were far above average over the Arctic Ocean and Canada. Air temperatures at the 925 hPa level (about 2,500 feet above sea level) were above the 1981 to 2010 average over the entire Arctic Ocean and, locally up to 10 degrees Celsius (18 degrees Fahrenheit) above average near the North Pole. This is in sharp contrast to northern Eurasia, where temperatures were as much as 4 to 8 degrees Celsius (7 to 14 degrees Fahrenheit) below average (Figure 2b). Record snow events were reported in Sweden and across Siberia early in the month.
...
In the Svalbard archipelago, sea ice usually begins to form in the inner parts of the fjords in early November. This November, however, no sea ice was observed. Throughout autumn, the wind pattern transported warm and moist air to Svalbard, leading to exceptionally high air temperatures and precipitation, which fell as rain.
...
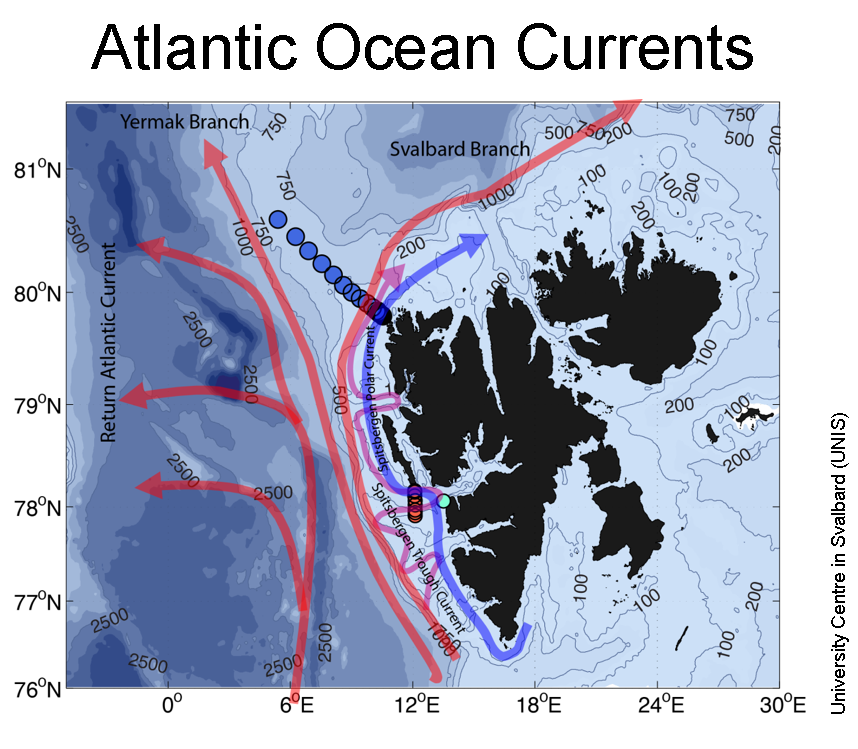
Since 2006, changes in atmospheric circulation have resulted in more Atlantic water reaching these fjords, reducing sea ice production in some and stopping ice formation entirely in others.
Source: NSIDC.

Figure 4b. The West Spitsbergen Current consists of three branches (red arrows) that transport warm and salty Atlantic Water northward: the Return Atlantic Current (westernmost branch), the Yermak Branch and the Svalbard Branch. The Spitsbergen Trough Current (purple) transports Atlantic Water from the Svalbard Branch into the troughs indenting the shelf along Svalbard. Since 2006, changes in atmospheric circulation have resulted in more warm Atlantic Water reaching these fjords. The blue and red circles on the figure indicate locations where hydrographic data were collected.
Credit: University Centre in Svalbard (UNIS)
High-resolution image
Arctic sea ice loss linked to rising anthropogenic CO2 emissions
A new study published in the journal Science links Arctic sea ice loss to cumulative CO2 emissions in the atmosphere through a simple linear relationship (Figure 6). Researchers conducting the study, including NSIDC scientist Julienne Stroeve, examined this linear relationship based on observations from the satellite and pre-satellite era since 1953, and in climate models. The observed relationship is equivalent to a loss of 3 square meters (9.9 square feet) for every metric ton of CO2 added to the atmosphere, compared the average from all the climate models of 1.75 square meters (5.8 square feet). This smaller value, or lower sensitivity, from the models is consistent with findings that the models tend to be generally conservative relative to observations in regard to how fast the Arctic has been losing its summer ice cover. The observed rate of ice loss per metric ton of CO2 allows individuals to more easily grasp their contribution to Arctic sea ice loss.
All cites and images above are courtesy NSIDC, except where otherwise shown.
-----------------------------------------------------------------------------------------------------
When a plane stalls you can get an interchange of potential and kinetic energy leading to a phugoid oscillation in flight level, as in the image below from the movie 'Battle of Britain'.
If you filter out the annual cycle of ice gain and loss you will see a phugoid oscillation in current Arctic sea ice extent as graphed by NSIDC.
There is a term used in control systems theory and design: hunting, which applies also. Hunting is the process by which a control system such as a ship's rudder actuator consistently overshoots the mark when correcting a previous oversteer, causing a new oversteer situation.
The drunkard's walk is also applicable to the current oscillations in sea ice growth.
-----------------------------------------------------------------------------------------------------
In 2007, Neven Curlin, a Dutch citizen now living in Austria who works as a translator, was stunned by the state of the Arctic, and particularly the floating ice that covers its ocean. It had shrunken to what was then the lowest extent yet observed by humans, just 1.61 million square miles in September at the end of summer. The dwindling of the planet’s icy cap, long predicted by scientists, was happening at a stunning pace.
Curlin, who had long been worried by global warming, began to follow the condition of sea ice closely and by 2010, started his own blog about it, unassumingly titled “Arctic Sea Ice Blog: Interesting News and Data.”
...
... I felt that Arctic sea ice is the frontier of global warming, where it’s going to be noticed most,” Curlin remembers now.
Scientists would agree — they’ve been predicting that the warming of the climate would be amplified in the Arctic for decades, and now there is clear evidence that’s happening. Moreover, these changes are reverberating across the mid-latitudes, potentially affecting our weather, our winters, and our sea levels through the melting of Arctic glaciers and the Greenland ice sheet.
...
Curlin just put the blog on hold, announcing what he called a “sabbatical (I hope).” He detailed a number of reasons, including not only personal ones (in addition to his job, he and his wife are home-schooling their daughter and busy building an eco-friendly house) but “the depression that comes with watching this steamroller just plough forward, is taking its toll.”
Source: The Washington Post.
Speaking for myself, I too have other commitments, so I have posted the snippets above in the hope that Neven's followers and other Arctic Ice watchers may wish to exchange comments with each other here at science20.com..


Comments