

Return to previous Arctic conditions is unlikelyIn the Arctic Report Card 2010, the term 'previous conditions' refers to the 20th century. My own studies go back to the settlement of Iceland in 857 CE. In that context, return to previously stable Arctic conditions isn't just unlikely, it is extremely improbable.
Record temperatures across Canadian Arctic and Greenland, a reduced summer sea ice cover, record snow cover decreases and links to some Northern Hemisphere weather support this conclusion
Arctic Report Card 2010
http://www.arctic.noaa.gov/reportcard/
As I write these words, the ice extent shown by NSIDC is only a little above 2007 levels for this date, and growth in extent is quite slow for the season:
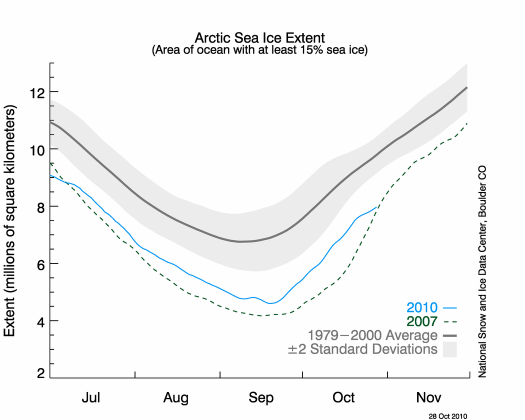
NSIDC graph 28 October 2010, 50% reduced size.
source: http://nsidc.org/arcticseaicenews/
Arctic sea and air temperatures remain unusually high for the month. Of particular interest are the sea areas around Greenland and the Canadian archipelago. Multi-year ice continues to be exported through Nares Strait into a relatively ice-free Baffin bay. There is also older ice in the passages between the Canadian islands, around which new ice is forming.
First-year ice is not necessarily thin ice. It can form into thick floes by over-riding ( slabbing ) and by forming pressure ridges. However, first-year ice remains salty, and as such is much weaker than older ice and more susceptible to melting.
Indications are that the melting of first-year ice in 2011 will cause a rapid reversion across the Arctic to the relatively small and mobile older floes seen this Summer. A further, and perhaps final, loss of multi-year ice can be expected.
Unless the Arctic sees unusually low temperatures before April 2011 - an unlikely event - it is highly likely, I suggest, that the central Arctic ocean will be virtually ice free by the end of Summer 2011.
An aside on climate science
Climate science is not so much a branch of science as the whole tree, roots and all. Findings from disciplines as diverse as linguistics, anthropology, psychology and nuclear physics can all add to our knowledge of climate history. Looking at the Arctic and Northern peoples, their histories and legends and their archaeological legacy we can determine that the events of the 21st century in the Arctic lie well outside the range of natural climate variability from 875 to 1999.
There are three Cs in science: continuity, cohesion, and confirmation. Scientific knowledge has a continuous history: facts don't just spring up from nowhere - they have antecedents. The parts of scientific knowledge fit together in a highly logical fashion: there is a cohesion of data and methodology which transcends the artificial boundaries of scientific disciplines. Science requires that observations are confirmed by independent observers: we have a wealth of independent observations about the Arctic covering many centuries.
The whole point of science is to investigate the unknown as far as is humanly possible. There will always be gaps in our knowledge, but the history of practical application of science to the solution of problems shows that problems can be solved without perfect knowledge. To give but one example: the steamer San Fransisco was disabled in the Atlantic in December 1853. Captain Jefferson Maury1, working in his study from theoretical principles of oceanography was able to predict the drift track of the disabled ship with such accuracy that the abandoned ship was found.
there is much about which we are still in ignorance. But the investigations of late years—especially those conducted under the superintendence of Captain Maury of the American Navy, and Doctors Carpenter and Thompson of England—have shown that our atmosphere and our ocean act in accordance with a systematic arrangement, many facts regarding which have been discovered, and turned, in some cases, to practical account.
R.M. Ballantyne,
The Ocean and its Wonders, 1874.
http://www.gutenberg.org/ebooks/21754
Observations about a general warming in the Arctic regions have been made and confirmed since interest in the Arctic was re-awakened in the 1500s. The theory of Arctic warming is backed up by solid evidence: evidence which is continuous, cohesive, and confirmed. If a team could get together and produce maps based only on confirmed observations in written records, I am very confident that we could reconstruct Arctic ice extent back to about 1500 with an acceptable degree of accuracy. Any oddness in reports can be filtered out using the tools of linguistics and psychology. Even sea monsters may be found to have a basis in fact.
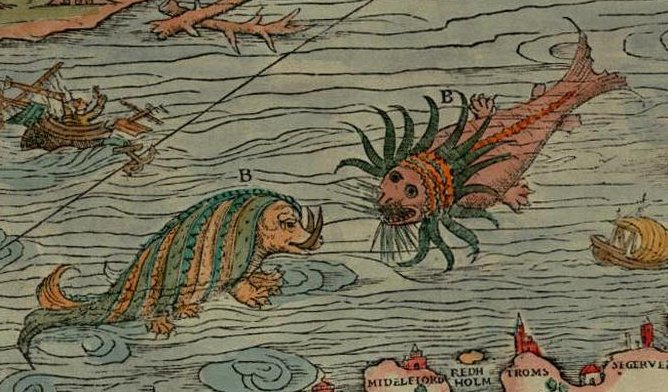
Two colossal sea monsters
The Carta marina created by Olaus Magnus, circa 1539, carries descriptions of some of the things featured. These two creatures - which look to me like an artist's rendition from a vague description of a walrus and narwhal - are described by Olaus Magnus as:
Two colossal sea monsters, one with dreadful teeth, the other with horrible horns and burning gaze - the circumference of its eye is 16 to 20 feet.Perhaps the 'circumference of its eye' is a misunderstanding of the 'radius of action' of a walrus from a hole in the ice, or the size of the hole it can punch. A walrus will commonly attack a hunter by submerging and then surfacing through the ice where the hunter would have been if he wasn't smarter than the walrus2.
Note also the driftwood off the coast of Greenland. That is a very interesting detail for such an early map. Driftwood was an important source of timber and firewood for the Viking settlers in Iceland and Greenland. Today, it is an important source of proxy data regarding the historic drift patterns of sea ice3.
I hope to write more about the Carta Marina in another article. The point made about it here is simply that good information can be extracted from superficially dubious sources.
Reports of Arctic warming
Investigations have revealed that in the last twenty years the Arctic Ocean has grown considerably warmer. According to nansen's observations of 1895, the temperature of the surface layer of cold water was about -1oC. The depth of this water layer was 656 feet. At a greater depth the temperature was above zero.The words above are from a 1939 book, The Conquest of the Arctic by Louis Segal.
The following extract mentions "recent climatic improvement", "climatic amelioration", and glacial mass loss "starting at some places 200 years ago and at others within the last 50 to 60 years". It was published in 1956.
With some exceptions, especially in Alaska, glaciers in arctic and subarctic regions have been shrinking for many decades and mostly at accelerating rates (Thorarinsson, 1940). In areas bordering the North Atlantic this shrinkage, starting at some places 200 years ago and at others within the
last 50 to 60 years, has been nearly universal and locally catastrophic. Many Alaskan glaciers have behaved in similar fashion, but others are now at their most advanced position in centuries (Field, 1932; 1937, pp. 69-76; Cooper, 1942). Most North Atlantic glaciers are still receding, but a number of Alaskan glaciers are advancing, have advanced recently, or have been in equilibrium for several years (Baird and Field, 1951, pp. 121-127; 1954).
The modern glacier recession in North Atlantic areas (Ahhlman, 1946, p. 24; Eythorsson, I949b) has been attributed to the "recent climatic improvement" involving a rise in winter, spring, and autumn temperatures, and to less marked degree in summer temperatures (Liljequist, 1949). Climatic amelioration is further suggested by the decrease in average thickness of the arctic ice pack from 144 inches to 86 inches between 1893-95 and 1937-40 (Ahlmann, 1946. p. 23). The navigation season to Svalbard has become longer, birds and fish are now found farther north, frozen ground is deteriorating in many areas, and vegetative growth has increased (Hustich, 1949). This climatic improvement is attributed to increased northward circulation of warm air, brought about by changes in atmospheric pressure gradient (Pertensen, 1949), and to an accompanying secondary effect produced by the Gulf Stream System (Helland-Hansen, 1949). The North Atlantic low, and perhaps also the North Pacific low, have moved farther north to produce these conditions. This is a grossly oversimplified statement, but, regardless, a rise in temperature more than a change in precipitation has been the major result, and temperature is the factor most strongly affecting the behavior of these glaciers (Ahlmann, l940a, p. 100).
This climatic amelioration culminated in late 1930s or early 1940s (Kincer, 1946, p. 342; Hustich, 1949, p. 103) and was followed by more continental conditions (Ahlmann, I953, pp. 22-27). Most glaciers of the North Atlantic region as yet display no marked reaction to this latest change, but the erratic and diverse behaviour of Alaskan glaciers may be an early response to the new conditions. Whether this is going to be a relatively minor perterbation in the history of general shrinkage or heralds a major reversal in behaviour is for the future to tell. Unfortunately, means of evaluating glacier fluctuations quantitatively are still inadequate. Data on total regime and over-all shrinkage of glaciers are more significant than fluctuations of the margins, the type of information usually available. The still scanty knowledge of the influence of various meteorological factors on accumulation and wastage makes evaluation of climatic fluctuations through glacier changes difficult and uncertain.
Glaciers in the Arctic / Sharp, R.P.
Arctic, v. 9, no. 1 and 2, 1956, p. 78-117, ill., maps
Contribution - California Institute of Technology. Division of Geological Sciences, no. 714
ASTIS record 9783
Index:
http://pubs.aina.ucalgary.ca/arctic/
This article:
Arctic9-1&2-78.pdf
The Arctic cannot warm in isolation. If the Arctic is warming, then so is the whole planet, albeit more slowly. The Arctic is indeed warming, and a general historic warming trend is traceable through various proxies back to at least the age of the Vikings. The little ice age was but a mild hiccup in a long-term warming trend. The rate of that warming has accelerated markedly since the start of the industrial era and again post 1950s. If global warming is a hoax, then it is a very long-running hoax perpetrated by explorers and sea-captains since at least the middle of the 17th century, for reasons which I am entirely unable to fathom.
-------------------------
[1] - Captain Jefferson Maury was grandfather of Matthew_Fontaine_Maury, 'father of modern oceanography'.
[2] - There is an excellent description of the contest between a hunter and a walrus in chapter 30 of Elisha Kent Kane's Arctic Explorations in Search of John Franklin, 1876.
[3] - Changes in Driftwood Delivery to the Canadian Arctic Archipelago: The Hypothesis of Postglacial Oscillations of the Transpolar Drift,
Arthur S. Dyke, John England, Erk Reimnitz, Hélène Jetté
Arctic, Vol 50 - 1.
http://arctic.synergiesprairies.ca/arctic/index.php/arctic/issue/view/64


Comments