

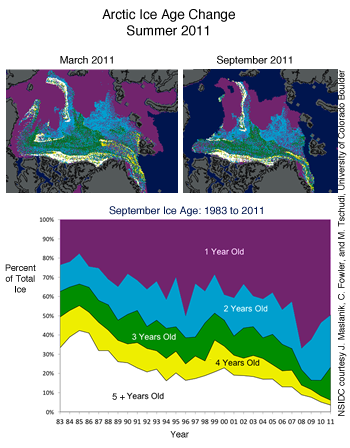
Ice extent, as measured down to 15% concentration, was only slightly above 2007 levels at the end of this year's melt season. The ice is now about as thin as in 2007, or thinner, and the age of remaining ice continues to decline. [edit: inserted missing clause - bolded.]
The summer sea ice melt season has ended in the Arctic. Arctic sea ice extent reached its low for the year, the second lowest in the satellite record, on September 9. The minimum extent was only slightly above 2007, the record low year, even though weather conditions this year were not as conducive to ice loss as in 2007. Both the Northwest Passage and the Northern Sea Route were open for a period during September.
...
While the melt season in 2011 got off to a slow start, the ice loss pace quickened during June. Ice retreated quite rapidly in the Kara and Barents seas, with rates more than double the average rate.
...
Continued loss of the oldest, thickest ice has prevented any significant recovery of the summer minimum extent. In essence, what was once a refuge for older ice has become a graveyard.
NSIDC
(My emphasis)
... “The ice has not recovered. This summer it appears to have melted to exactly the same degree as in 2007. Yes, it is exactly as thin as in the record year,” says Hendricks.The age of Arctic ice is a very important indicator of its health. The average age of the ice continues to decline. NSIDC - link above - reports that coverage of the oldest, thickest ice types (ice four years or older) has declined over the past 28 years, as shown in the next graphic.
http://www.irishweatheronline.com
AMSR-E Failure
Since the commissioning of the Aqua satellite, ice extent has been measured by most observers using the satellite's AMSRE-E - Advanced Microwave Scanning Radiometer - EOS. The failure of AMSR-E was published in this press release but has not as yet been taken up by the mainstream news media. I believe that Roy Spencer deserves credit as the first blogger to publish details about this event. The line drawing below, from a NASA publication, shows the location of AMSR-E on the satellite. The other instruments are still fully functional, or as NASA prefers to say: 'operating nominally'. (Unfortunately, in British English, 'operating nominally' means 'working, but only just'.)
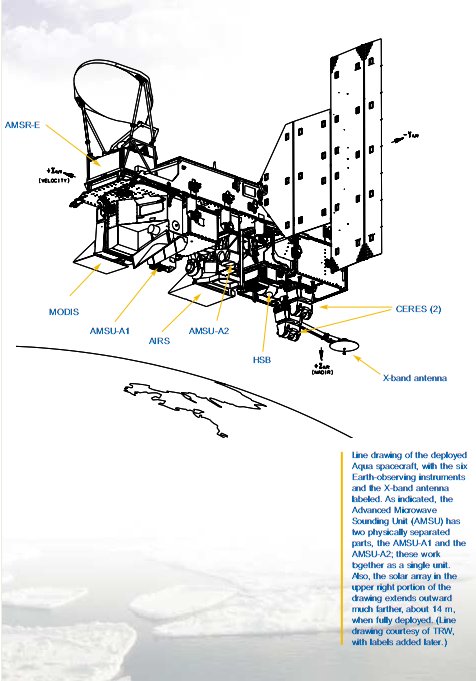
Aqua satellite showing six Earth observing instruments.
The problem which caused the shut-down of AMSR-E was an apparent lubrication failure. Lubrication in space is not a matter of a splash of oil. The alternation of intense heat from the sun and the intense cold of space, together with the vacuum of space, poses great problems for the engineering of rotating parts. Given the projected 3-year life of the equipment and the fact that it has performed reliably for 9 years, the engineers responsible for the design are to be congratulated on a job extremely well done.
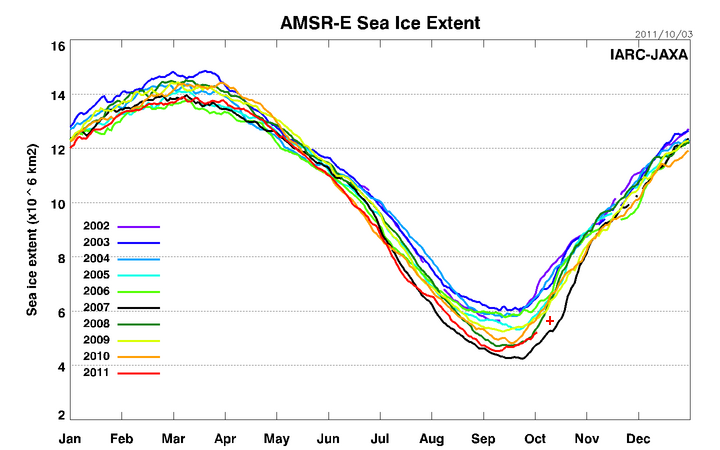
The Cryosphere Today site and Robert Grumbine report that SSMI will be used in place of AMSR-E. Hopefully, the new data will be capable of integration with the historic records from AMSR-E. The last AMSR-E sourced graph of ice extent was posted by JAXA on October 4th 2011. I have marked the graph with a cross to show my estimate of the likely extent as of October 10th.
It is possible to estimate the ongoing changes in ice extent by checking sources which do not use AMSR-E, such as the visible spectrum images from NASA and the National Centers for Environmental Prediction (NCEP) Sea Surface Temperature maps. The Arctic Mosaic below and the SST map give a very good indication of where ice extent is growing - or failing to grow as the case may be.
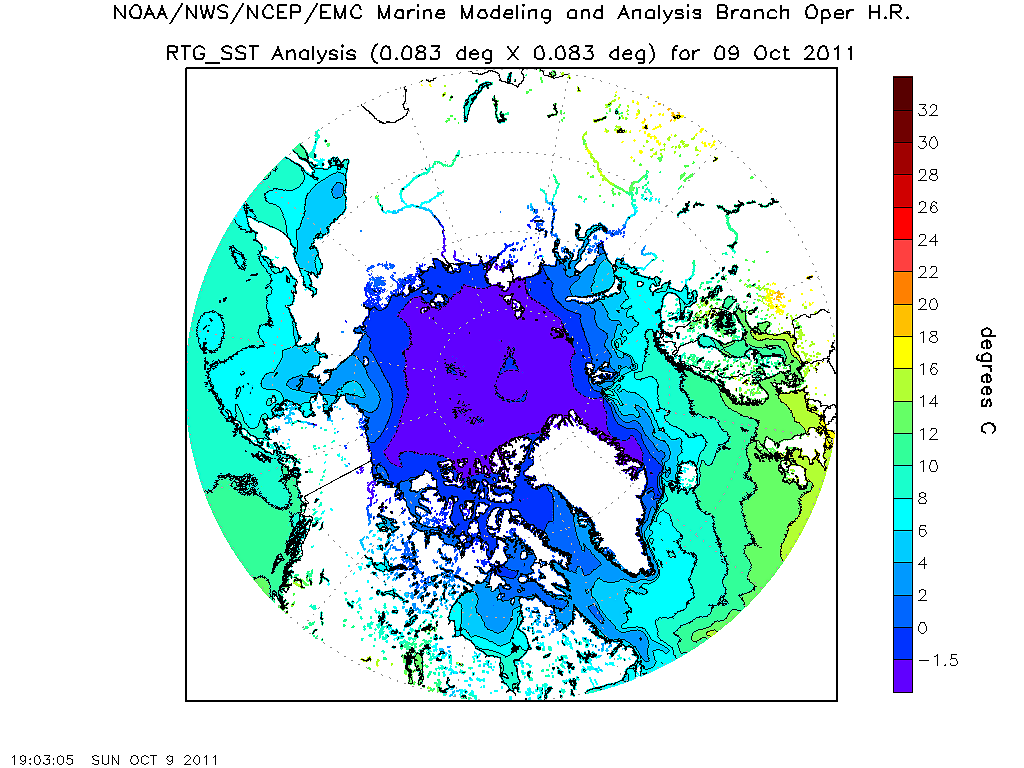
SST map Oct. 09 2011
Source: NCEP NOAA
The purple area shows a close agreement with visible spectrum images of ice-covered sea areas.
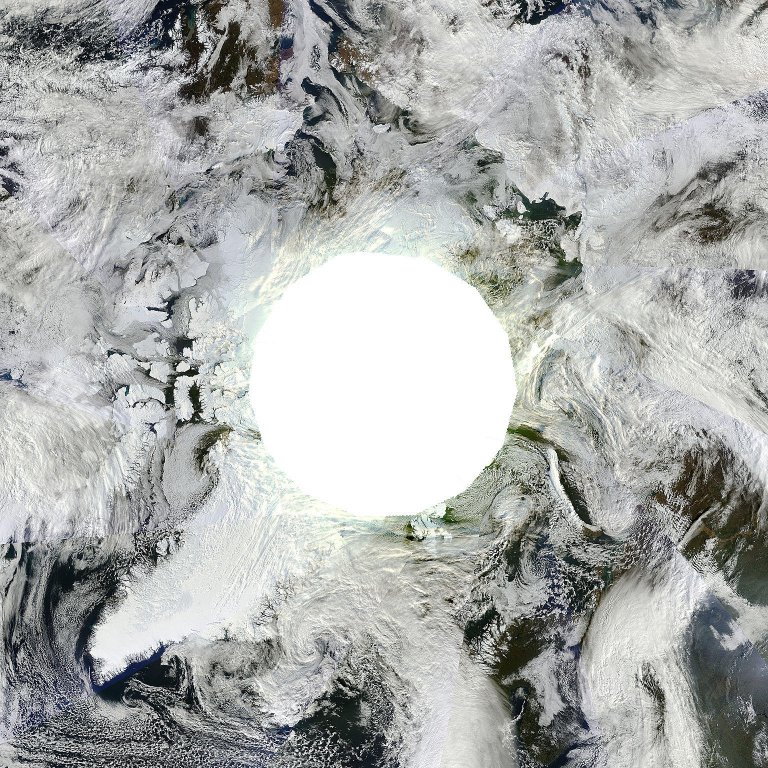
Arctic mosaic, resized to 8km scale.
Source: LANCE NASA.
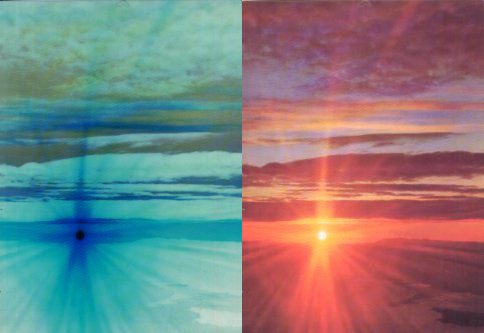
The greenish tint seen in the above image around the white circle which denotes the 'circle of Arctic night' arises from the scattering of light. An observer on the ground will see a reddish sunset as the atmosphere scatters the other colors of the spectrum. The observer in space sees the upward scattered 'not-reds': the negative colors shown in the Greenland sunset images below. For more information on the idea of 'not-colors', please see: What Color Is An Orange ?
.
The comparison between historical Arctic norms and modern trends bears constant repetition. In 1878, the USS Jeannette was crushed by the ice in June. The crew hauled their boats over the ice until they reached open water in September. As of October 10 2011 the areas where those events took place are still mostly open water. The image below shows the Lena Delta area where many of the Jeannette's crew perished.
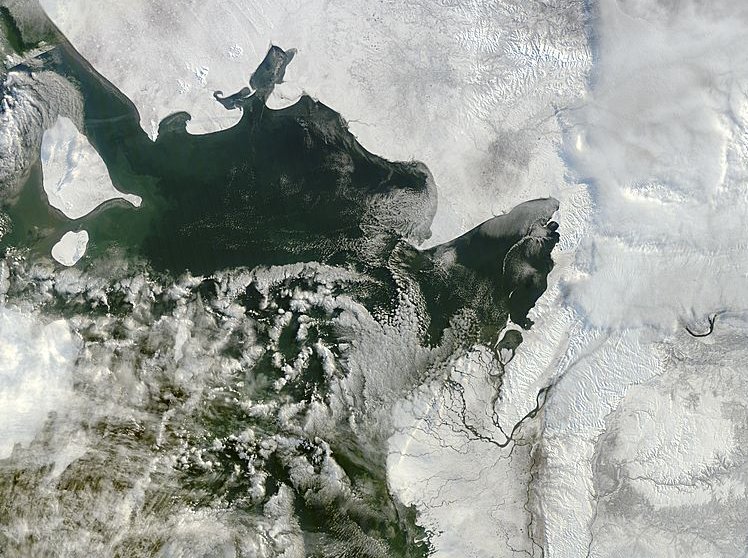
It was also in 1878 that the Vega was trapped in ice. She survived that event and became the first ship to complete the passage from the Atlantic to the Pacific via the Siberian coasts.
Historic changes and current changes
As noted in A Brief History Of Arctic Warming, the Arctic went through a period of about 200 years in which ice extent was sufficiently above previous norms to prevent navigation by ships. Baffin Bay was ice-choked from 1617 until 1817. From 1648 until about 1879 the coastal area between Kolyma and Bering Strait was blocked. Attempts to reach the lost Viking colonies of Greenland were generally unsuccessful due to ice extent until 1721, when Hans Egede succeeded in reaching the southern parts of the West coast of Greenland, but he was not able to explore the East coast. Until 1822, when William Scoresby charted about 400 miles of the East Greenland coast, that coast was generally considered unreachable by ship.
Conclusion
It is likely that the increased Arctic ice extent, which lasted about 200 years, returned to its previous lower norms within about 100 years. That new norm in turn lasted only about 50 years. For the next 50 years the ice was in decline, and the decline then steepened. It seems likely that the effects of global warming are dominating natural variability: the ice will continue to vary in extent but it seems to me to be unlikely in the extreme that natural variability alone will cause ice extent to recover to 1950 levels.
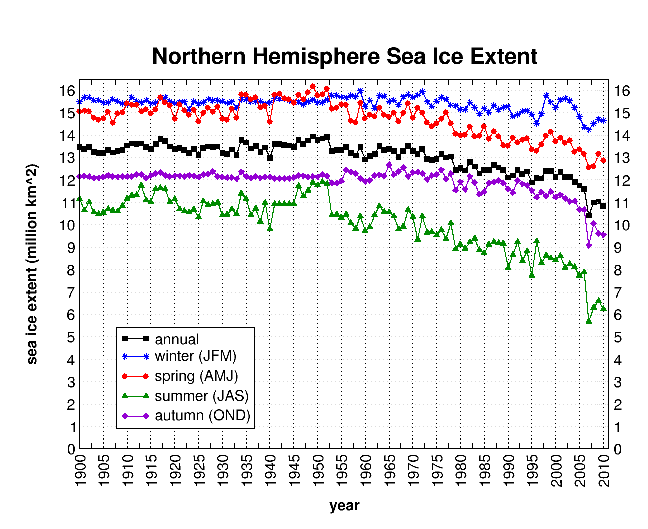
Seasonal ice extent 1900 - 2010
Source: The Cryosphere Today


Comments